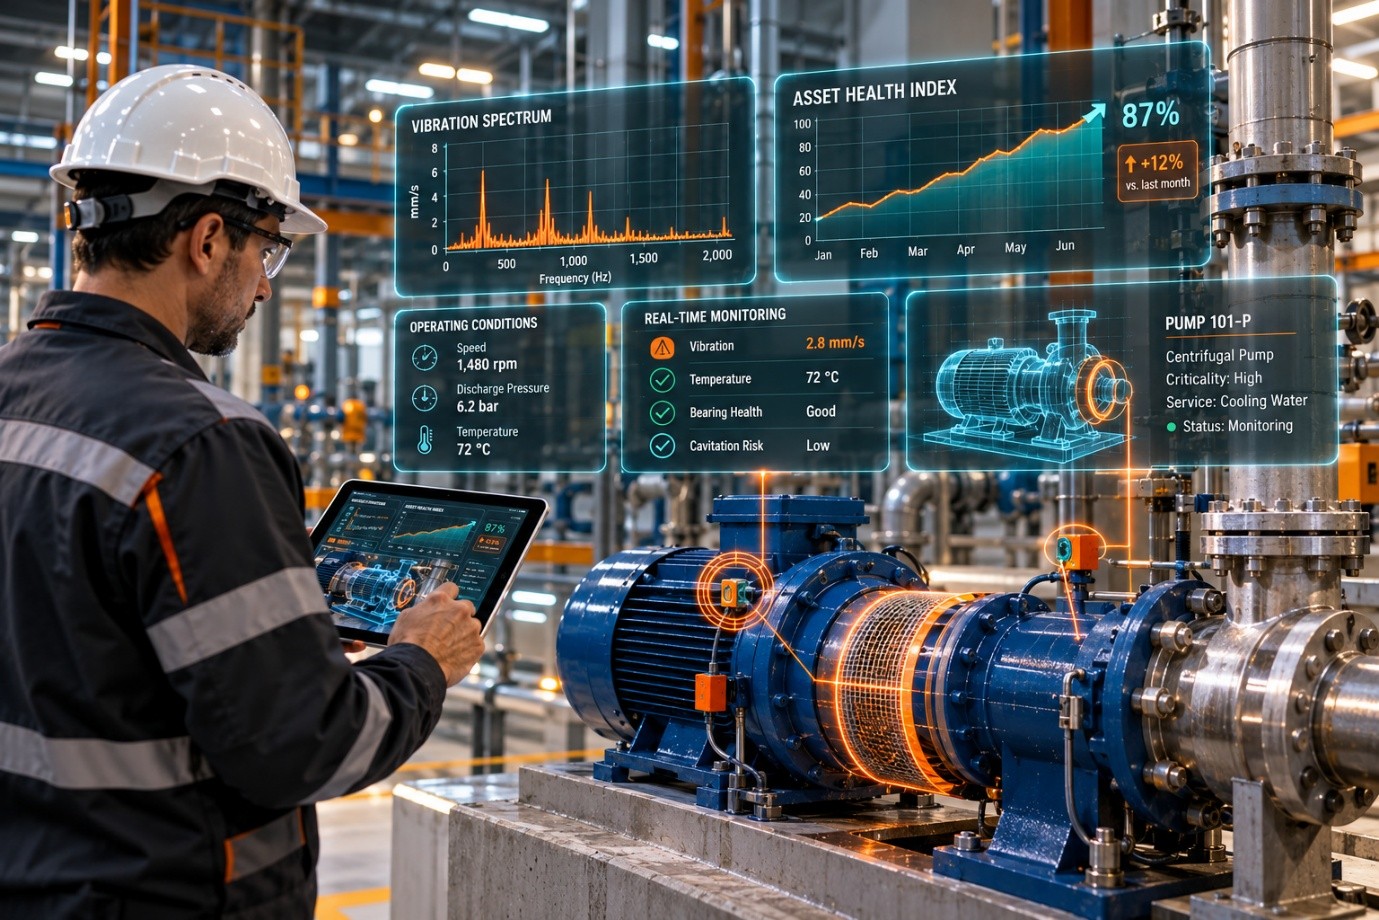
Industrial AI has a credibility problem of its own making: years of pilots that demoed beautifully and died quietly. The gap is not algorithms. It is data quality, integration, and knowing which problems are worth solving. So let us talk about the use cases with a track record of surviving contact with reality.
Redwood’s 2026 outlook puts the split at 98% of manufacturers exploring AI against roughly 20% who consider themselves fully prepared to deploy it. Their figures, not ours — but the shape matches what the pilot graveyard looks like from the inside.
Predictive maintenance: listening earlier on the P–F curve
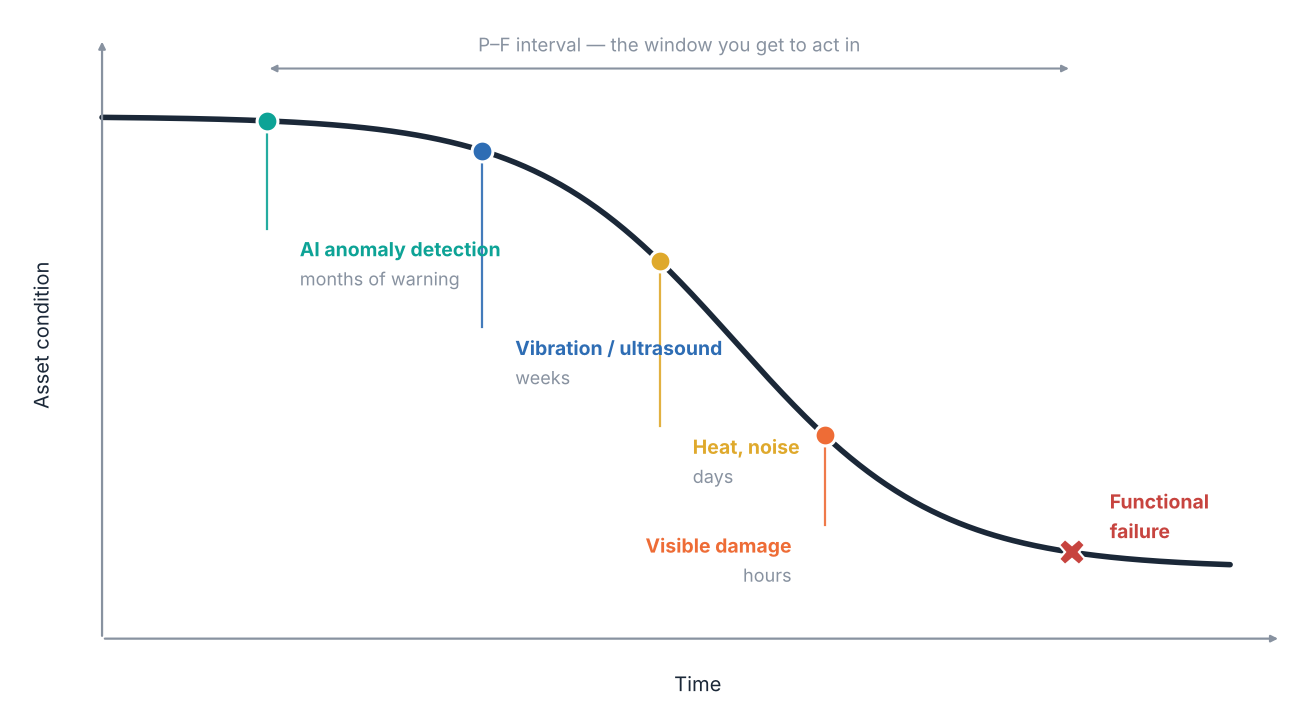
Every mechanical failure runs down the same slope. A long quiet degradation, then detectable symptoms, then obvious ones, then the bang. Maintenance engineers call it the P–F curve: the interval between the Potential failure signal and the Functional failure.
Traditional condition monitoring — vibration routes, thermography — catches symptoms weeks out. Machine learning models listening to continuous sensor streams catch the statistical whispers months out: subtle shifts in the relationship between load, temperature and vibration that no threshold alarm would flag, because no single variable has left its band.
The economics are blunt. An unplanned stop costs multiples of a planned one once you add expedited parts, collateral damage, lost production and overtime. The pattern across deployments that stick: start with the ten assets whose failure hurts most, not a plant-wide rollout.
Siemens reports AI-driven maintenance delivering around 20% lower maintenance costs and 15% higher uptime in its own operations. Worth knowing, worth treating as a vendor reporting on itself rather than as a number to put in your own business case.
Soft sensors: measuring the unmeasurable
Some of the most valuable numbers in a plant cannot be measured directly in real time. Polymer melt index. Distillation column composition. Pulp quality. The traditional answer is a lab sample every four hours, which means steering quality with a four-hour-old snapshot.
A soft sensor is a model that infers that quality continuously from the measurements you do have: temperatures, pressures, flows. The blind spots between lab samples close, and the quality loop can react in minutes rather than at the next shift. Soft sensors are among the lowest-drama AI applications in process industries, and they have been quietly working for years.
Anomaly detection: a tireless second pair of eyes
An experienced operator develops a feel for when the plant sounds wrong. Anomaly detection models learn the same intuition statistically: they model normal multivariate behaviour and flag departures from it, often before any single variable crosses an alarm limit.
Done well
Catches developing problems that threshold alarming structurally cannot, because each variable on its own is still ‘fine’.
Done badly
Floods operators with false positives until they stop looking, and joins the graveyard of nuisance systems.
The discipline that separates the two is not modelling talent. It is involving operators in triaging alerts from day one, and measuring the model on precision rather than recall alone. A model that catches everything and cries wolf weekly is worse than no model, because it spends the one thing you cannot rebuy: the control room’s attention.
The uncomfortable prerequisite
Every use case here inherits its ceiling from the foundations earlier in this series: sensor health, data architecture, and stable base-layer control.
A predictive model trained on data from oscillating loops learns oscillation as normality.
This is the quiet reason ‘AI readiness’ work so often turns into instrumentation and data-architecture work. It is also why engineers who hold both classical process knowledge and data skills are among the scarcest people in the market. A twin of a badly measured plant is a beautifully rendered fiction, and a model trained on one is a confident wrong answer.
Key takeaways
- Nearly every manufacturer is exploring AI; a fraction feel ready. The gap is data and integration, not algorithms.
- Predictive maintenance moves detection earlier on the P–F curve — planned Tuesday jobs instead of 2 a.m. emergencies.
- Soft sensors turn four-hour lab delays into continuous inferred measurements. Proven, and undramatic.
- Anomaly detection succeeds or dies on false-positive discipline and operator involvement.
- Every AI use case inherits its ceiling from instrumentation, data architecture and stable base-layer control.
What’s your take?
Which of the three has actually survived on your site — and what killed the one that did not? Join the conversation.
A 12-part journey from the sensor to the self-driving plant.
Each week, one article — building from the 4–20 mA loop all the way to plants that run themselves. Brought to you by SynapseAI.
Pilot that demoed well and went nowhere?
We advise on industrial data architecture, industrial AI and digitalisation — vendor independent.